The Arctic cryosphere comprises several distinct frozen elements, including sea ice, ice on lakes and rivers, snow, ice within frozen ground (permafrost), and land ice (e.g., glaciers, ice caps, and ice sheets).
In the Arctic, more than 90% of the land ice is found in Greenland. The volume of ice within the Greenland Ice Sheet amounts to approximately three million cubic kilometres, covering around 80% of the island. If all this ice were to melt and be added to the oceans as water, it would raise global sea levels (‘eustatic’ sea level rise) by an average of 7.4 metres.
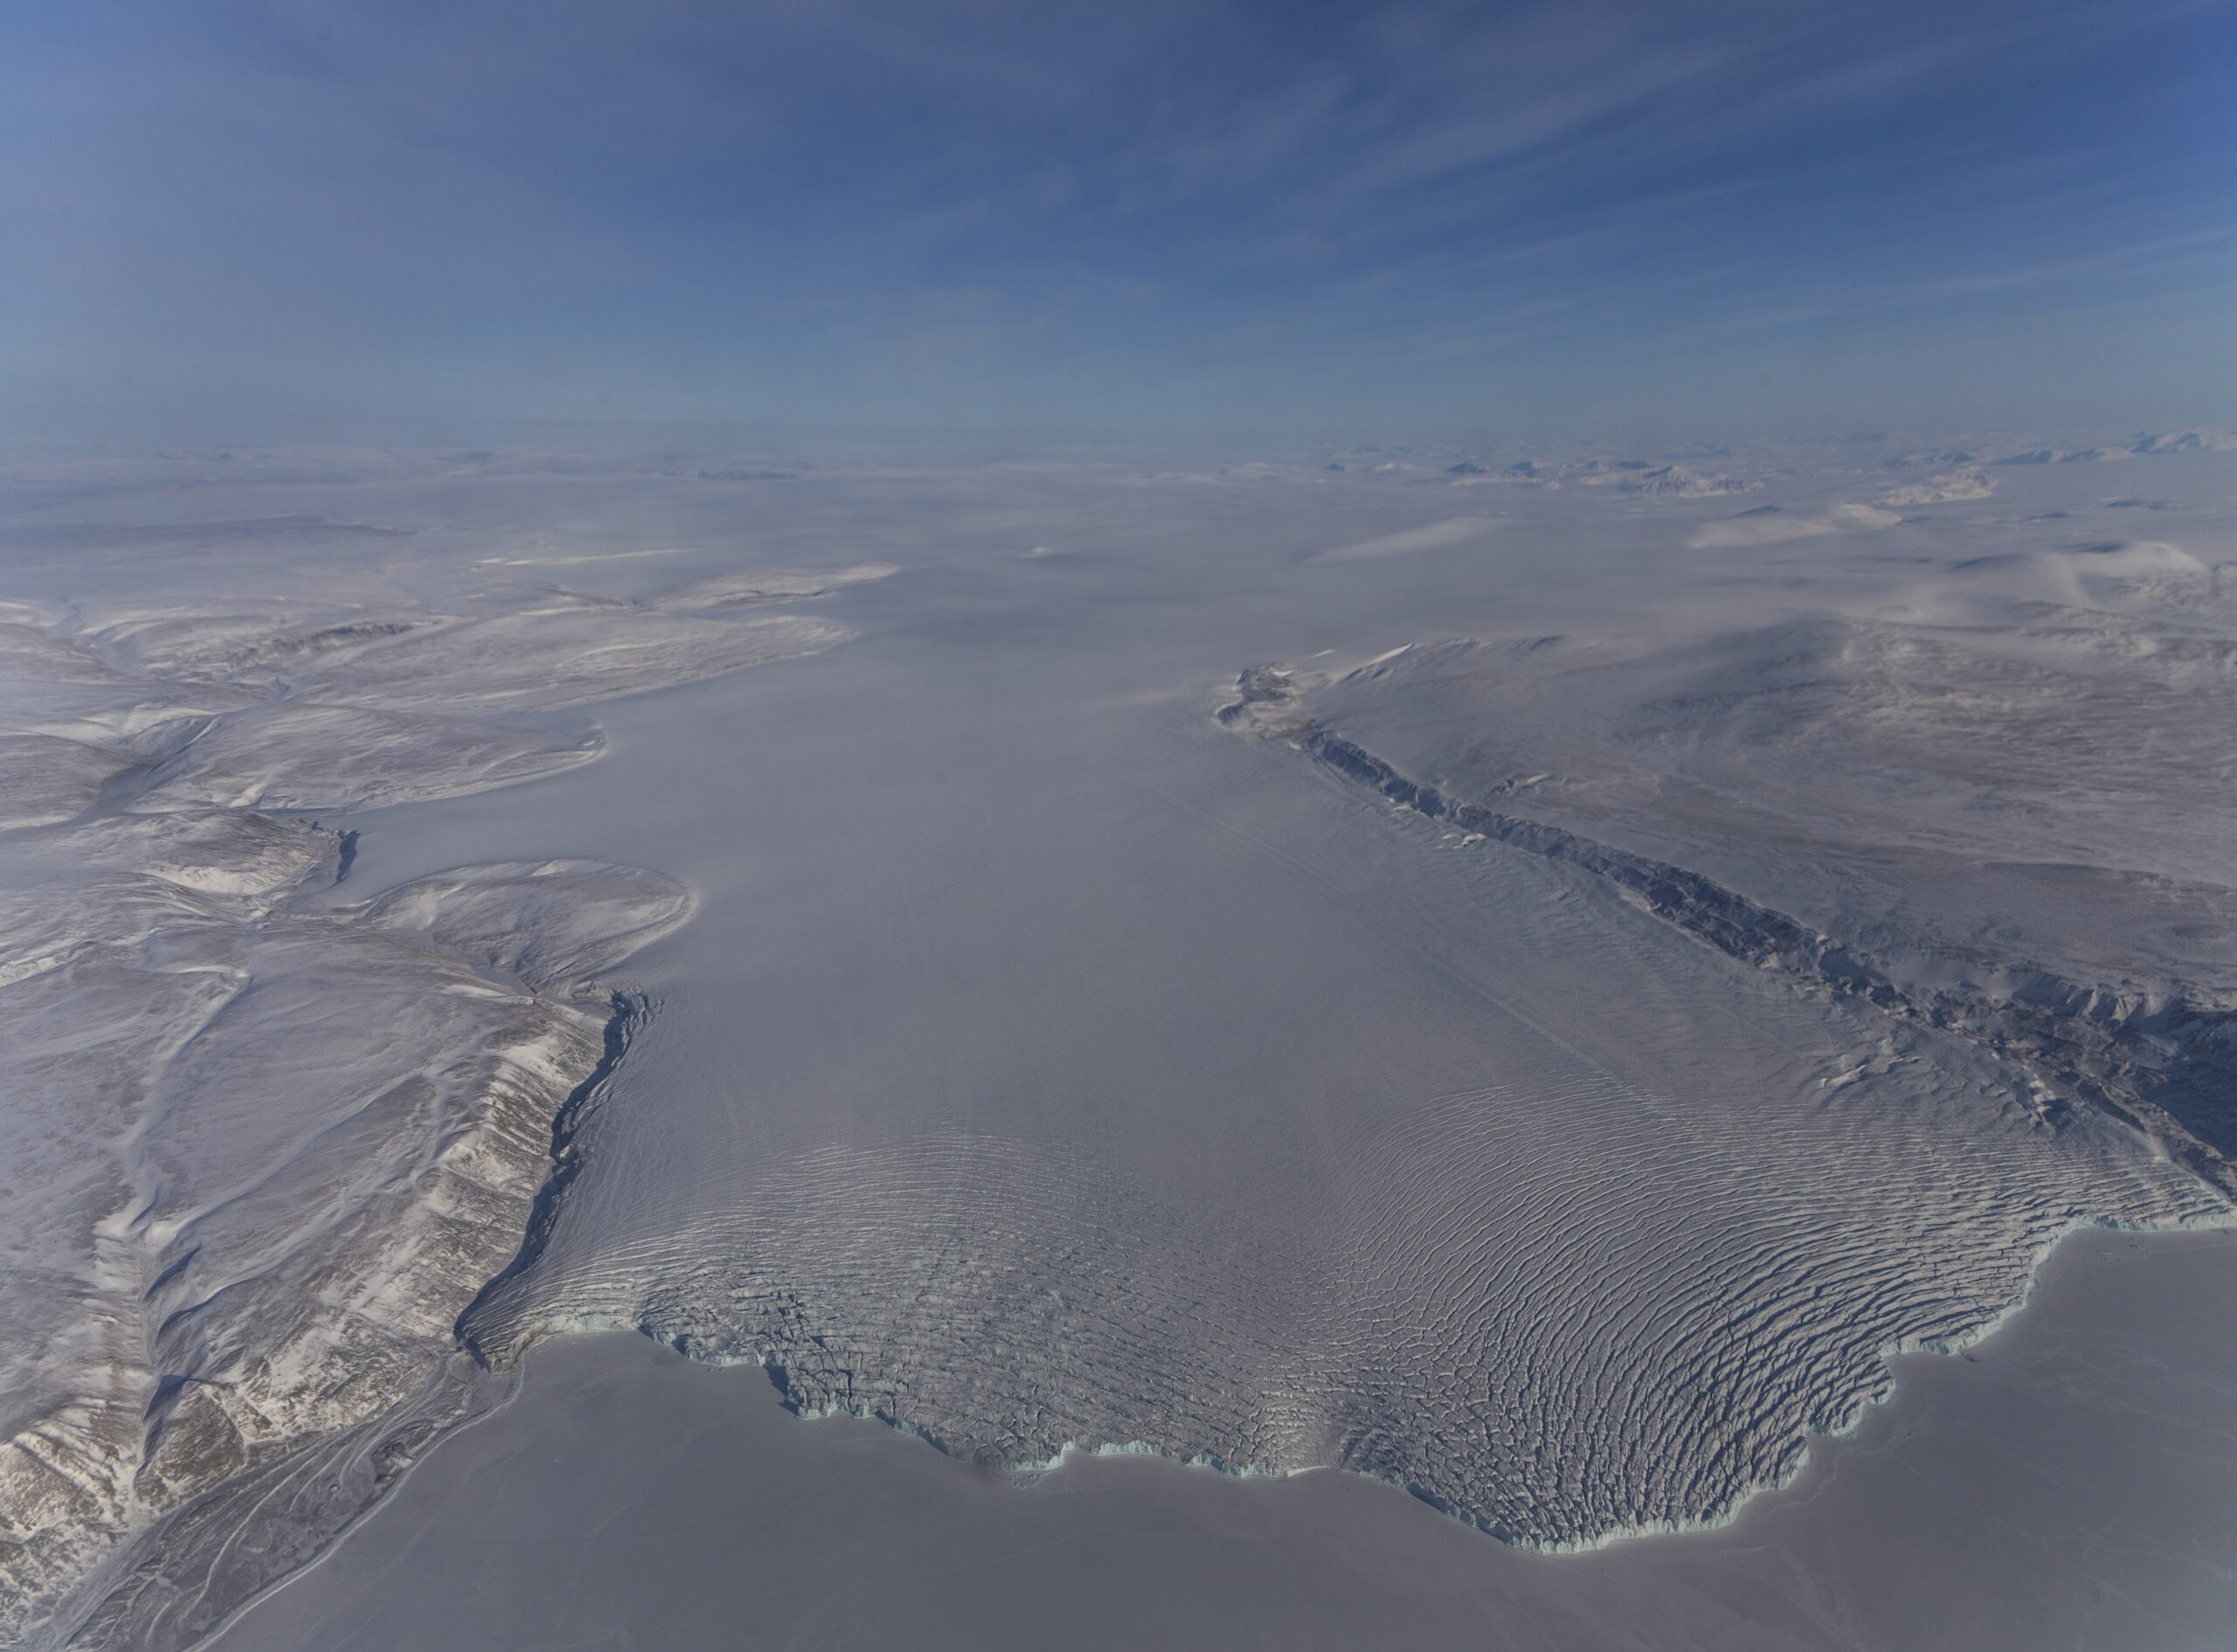
Ice flows from the centre of the Greenland Ice Sheet (~3200 m above sea level) towards the sea through a network of hundreds of ice streams and outlet glaciers. In contrast to Antarctica, which is surrounded by large ice shelves (floating extensions of glaciers), the Greenland Ice Sheet margin has a smaller number of glacial ‘ice tongues’, which are confined to fjords.
History of ice in Greenland
The timing of initial glaciation in Greenland is uncertain. Studies of sediment deposits from the seafloor indicate that Greenlandic glaciers and ice caps began to form more than 10 million years ago. These early glaciers probably formed in favourable locations (i.e., higher altitudes and latitudes, where temperatures were colder). At this time, Greenland likely resembled modern-day Patagonia, with ice caps and glaciers covering the mountains, but no ice at lower elevations. A large Greenland Ice Sheet, covering most of the island, developed less than 3 million years ago in response to global climate cooling. In contrast, Earth’s other large ice sheet, the Antarctic Ice Sheet, formed more than 30 million years ago.
Once an ice sheet begins to develop, its growth is reinforced through positive feedback mechanisms. For example, ice reflects more sunlight back to space (a high ‘albedo’), which acts to further cool the continent and allow more ice to grow. Also, as ice sheets grow, their surface elevation becomes higher and therefore cooler, further reinforcing cold conditions and ice growth.

During the Quaternary Period (the last 2.6 million years), the Earth has experienced natural cycles of warming and cooling driven by subtle changes in its orbit around the sun (‘Milankovitch cycles’). During the cooler periods (‘glacials’), a series of ice sheets existed in the Northern Hemisphere high latitudes, including in North America and northern Europe (including the British Isles). The Greenland Ice Sheet was also much larger during these times. By contrast, during warmer periods (‘interglacials’), Greenland likely had significantly less ice than today. Today, the Greenland Ice Sheet is the only ice sheet to remain in the Northern Hemisphere.

Measuring the thickness of ice
The thickness of ice sheets is measured using radar systems that are mounted on aircraft. Radars send out electromagnetic waves which pass down through the ice and bounce back off the land at the bottom. By measuring the time taken for the signal to return to the aircraft, we can calculate the thickness of ice and the height of the land beneath. This has revealed that central parts of the Greenland Ice Sheet are more than 3 km thick. Radar images also show the layers of ice below the surface, which can use to learn how the ice sheet has accumulated and been deformed over time.

The land beneath the ice
Measurements of ice thickness derived from radar surveying have allowed us to build a map of the topography beneath the Greenland Ice Sheet. We can see that Greenland is ringed by a chain of coastal mountains, which rise to more than 3000 metres above sea level. By contrast, the centre of Greenland is much lower and flatter. It looks like a huge bowl. Much of this central region is lying at or below current sea level.
One reason for this is that the mass of large ice sheets is sufficient to depress the elevation of the land upon which they sit. The Greenland Ice Sheet pushes the Earth’s crust down into the mantle below; a process called ‘isostasy’. If the ice sheet were to be removed, the land would slowly rebound over thousands of years, in total by as much as 800 metres.
We can also use the subglacial landscape as a window into Greenland’s deep past. The distribution of landforms of glacial erosion (e.g., U-shaped valleys, pyramidal peaks, arêtes, cirques, and fjords) can tell us where the ice has modified, and is modifying, the landscape. Perhaps surprisingly, we also see networks of valleys beneath the ice sheet that were eroded by running water. These features were probably incised by rivers at a time when there was much less ice in Greenland. They have survived because large parts of the ice sheet are so cold and slow-moving that they protect the topography from the usual effects of erosion driven by wind, water, and sliding ice. The ice sheet has literally frozen parts of the landscape in time.

Contemporary change in Greenland
There is now a lot of attention given to measuring the impacts of a warming climate on the Greenland Ice Sheet, and estimating how it will continue to evolve into the future. Remote sensing (e.g., using satellite measurements) is ideal for monitoring a large ice sheet, much of which is inaccessible for most of the year. Satellite estimates of ice-sheet mass balance show that Greenland lost around 5000 gigatonnes (1 gigatonne = 1 billion tonnes) of ice between the early 1990s and early 2020s. Ice mass loss is largely driven by two mechanisms, which contribute approximately equally. The first is an increasingly negative surface mass balance (i.e., more ablation than accumulation) due to increased surface melting. The second is enhanced glacier discharge (i.e., glaciers that feed ice from the interior to the ocean are speeding up). Despite its smaller size, Greenland is currently losing ice more quickly than Antarctica.

The future
The future of the Greenland Ice Sheet will depend on the greenhouse gas emissions pathway we follow. Computer models that simulate ice-sheet behaviour are used to project their future evolution under a warming climate. State-of-the-art models used by the Intergovernmental Panel on Climate Change (IPCC) currently project that the melting of the Greenland Ice Sheet will contribute ~10 cm to global sea-level rise by the year 2100 under a high emissions scenario. This number will be lower if the rise in CO2 concentrations in the atmosphere is slowed or halted.
Aside from causing eustatic (global average) sea level to rise, there are other important consequences of ice loss from Greenland:
- In Greenland, the reduction in mass of the ice sheet will cause the land to rebound upwards (via isostasy). The land will rise faster than the nearby ocean, meaning that the isostatic (local) sea level fall around Greenland will be greater than the eustatic (global) sea level rise. This means that Greenlandic coastlines will experience a fall in sea level and more land will emerge from beneath the shallow coastal waters as the ice sheet melts. This will be significant for local communities in Greenland, whose way of life relies on coastal infrastructure, shallow waterways, and fish habitats.

2. Melting of ice will add more freshwater to the North Atlantic Ocean. This will change the temperature and salinity of the water, affecting ocean circulation patterns that are vital for regulating temperatures around the world.
3. More land will become ice-free in Greenland. This will impact the distribution of plant and animal species. It will also decrease the average albedo of the island, meaning that less sunlight is reflected into space, causing further warming and driving positive a feedback loop of melting (known as ‘polar amplification’).
